

All actors in DiD Risk Monitor plays according to given scenario data. The scenario data are expressed be State Chart Diagram.
State Chart Diagram is generally used to describe dynamic behavior of target (Ex. machine and people) in the field of the Systems engineering.
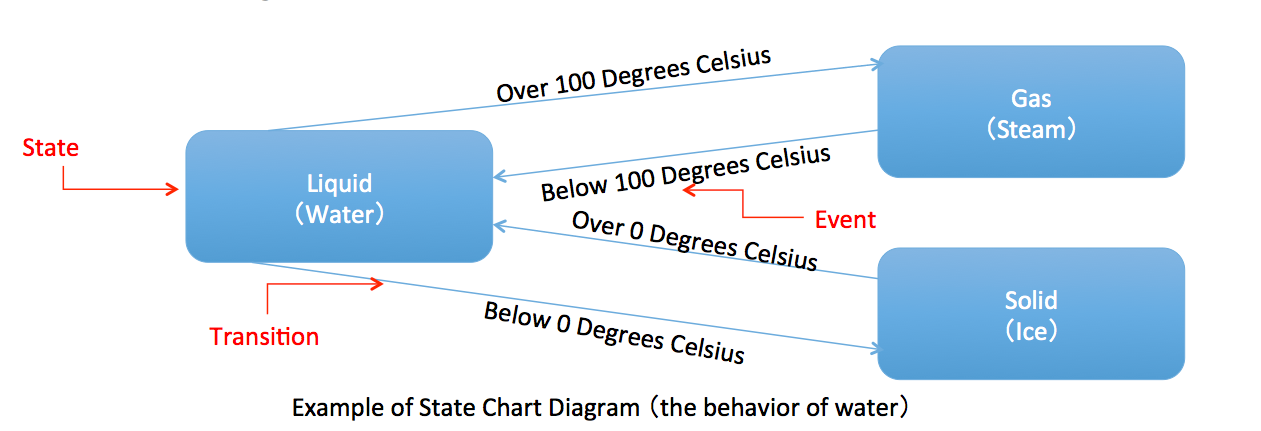
As described below diagram, the state chart diagram consists of rounded rectangles (the state), arrowed lines which connects one state to another (the transition) and triggers condition for the transition which written below the transition line(the events).
This state chart diagram describes the behavior of water as example. In the diagram, we can see the water has three states like a water, gas and solid, and these state has changed when the temperature becomes over/below 0/100. The temperature changes are event and triggers for the state transition.
Now we think how to express the operation scenario data by the state chart diagram.
For ease of explanation, we consider very simple operation scenario like a “do A at first”, “do B after completing A” and “do C after completing B”.
A,B and C are actions which the people should do, and “at first”, “after completing B” and “after completing C” are thought as preconditions to do the actions.
We suppose the actions as the states for doing the actions in the diagram, the preconditions are also supposed as the event of the state chart diagram.
The below diagram is an example of operation scenario expressed by the state chart diagram.
In the diagram, each state has action module. DiD Risk Monitor provides several action modules to express operation action and we can create scenario data by placing the proper action module into each state.
Next, the states are connected by the transition from left to right and the events are set to make the transition, the event is normally OK or NG which means the action is succeeded or failed. (Ex. OK@action or NG@action)
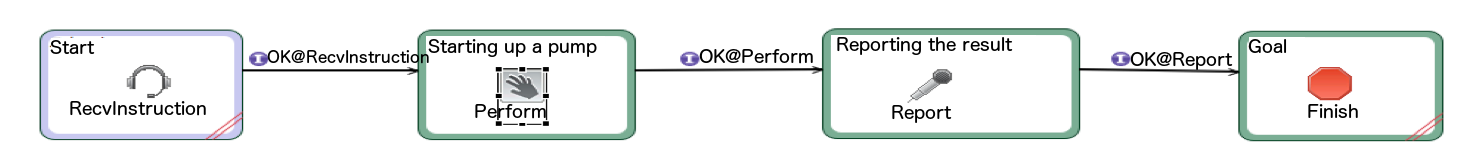
The simple operation scenario like “do A at first”, “do B after completing A”, “do C after completing B”. can be modeled the sequential state chart diagram in above diagram.
Even if there are a lot of scenario data, they can be entered easily, because DiD Risk Monitor provides several functions as follows;
- Data input support function (Ex. only selecting the “OK” or “NG” to set the event)
- Data consistency check functions (Ex. checking the match between name of the event and the action, lack of definition of the event and etc),