
You can enter a work place map as special state chart diagram in “DiD Risk Monitor”.
At first, scan the map of the all work places, and set the scanned image as the background of the state chart diagram.
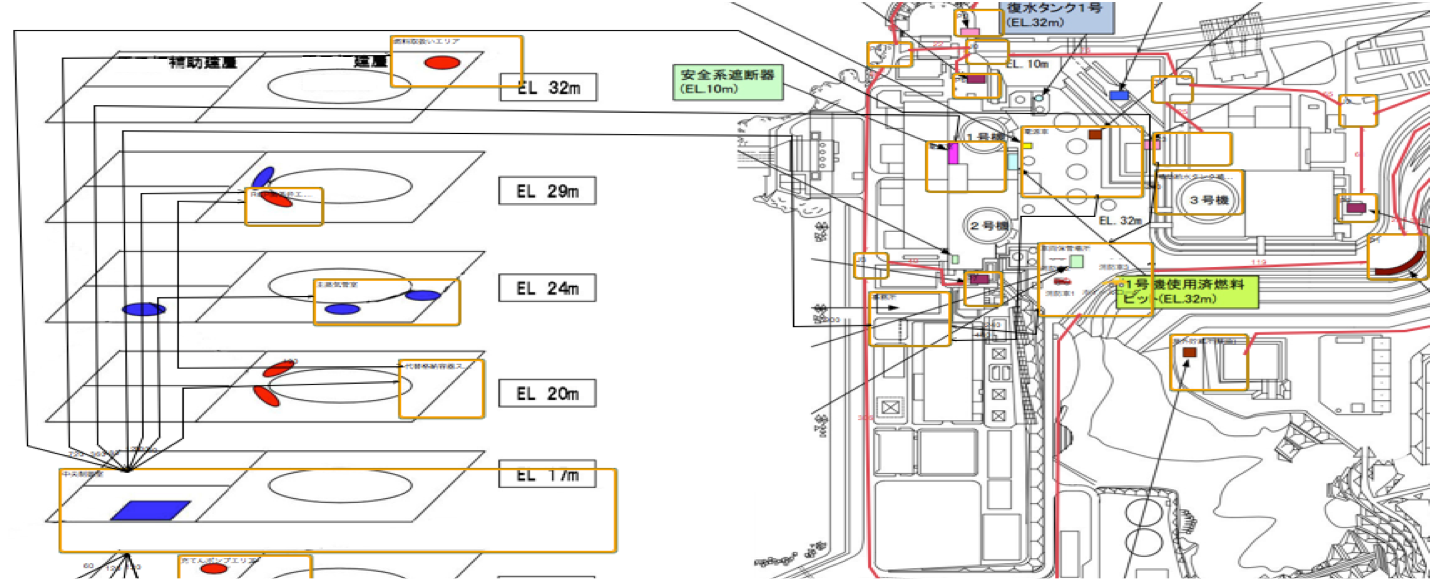
Next, place all work places by using state components on the state chart diagram. (In the below figure, work place is displayed in rounded rectangle.)
Then, connect transition lines among the states as traveling route. The color of transition line means traveling mode, the black line is on foot, the red line is car.
And enter traveling time at a property value of the transition line.
Interaction simulator calculates and uses an appropriate route when the actor move from place to place.
Road closure because of accidents can be considered by deleting the transition lines in the map.