

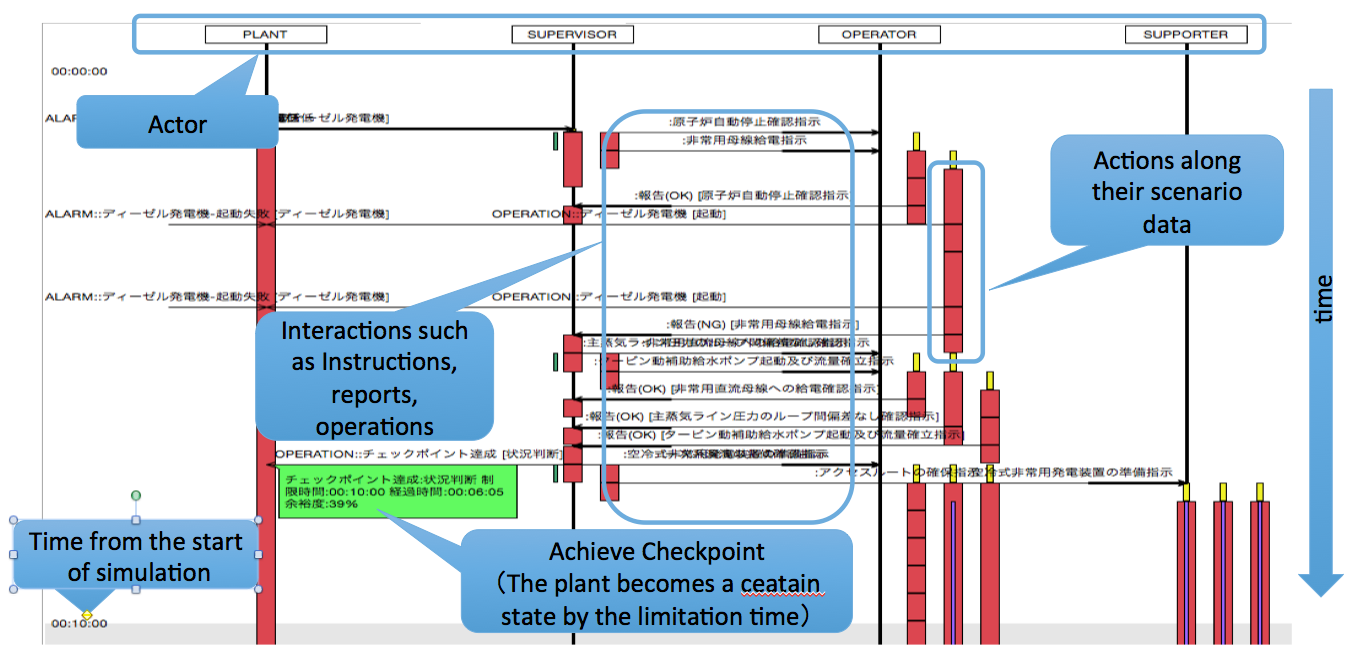
The result of “Interaction Simulation” is recorded in the form of Sequence Diagram as below Figure.
All actors are laid out horizontally in the Sequence Diagram and the interaction among actors such as event exchange and the execution of the task are arranged in time sequence.
The arrow line between actors shows sending and receiving Events, which means Instructions, reports, operation and so on.
One red box shows executions of one basic task. Plural red boxes arranged vertically shows the execution plural steps defined in a “State Chart Diagram”.
The green label is placed on the left side in the figure, it means that a checkpoint was achieved before its limitation time.
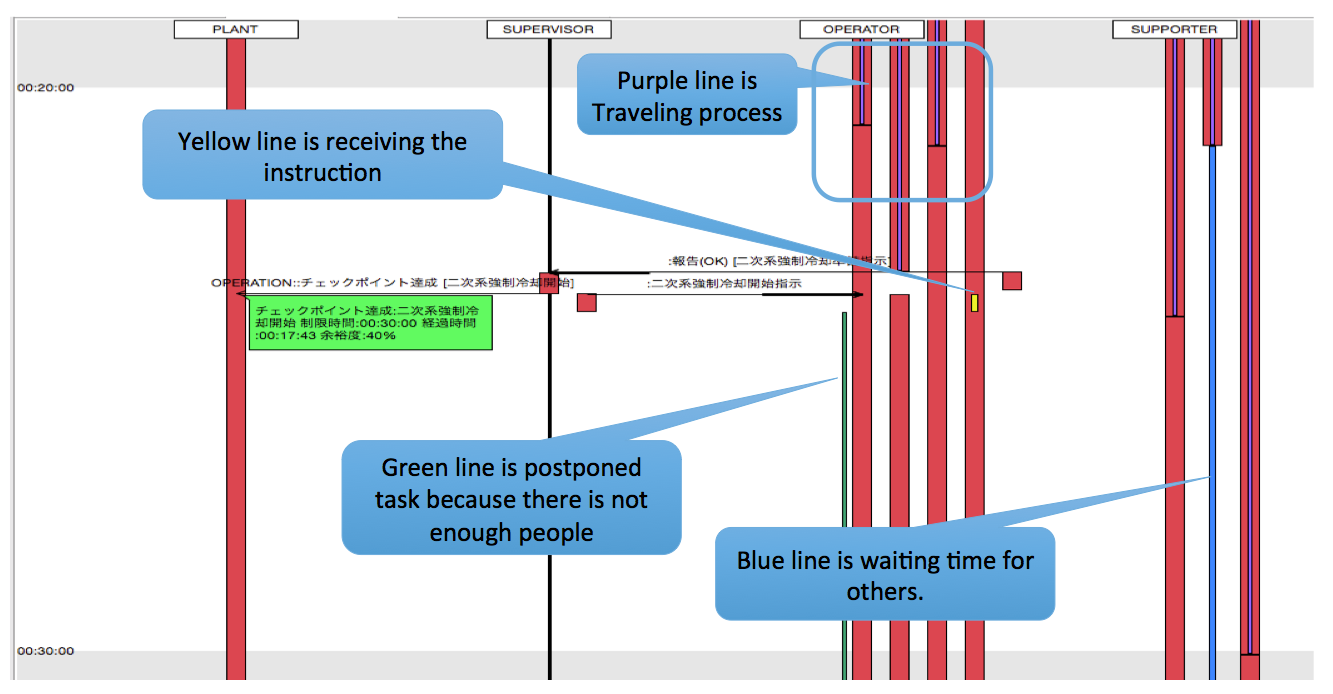
One actor has plural vertical lines, it means the actor has plural teams and they are working in parallel.
Some red box has colored line its inside.
Purple lines in red boxes shows the traveling process.
Yellow lines mean receiving the instruction from other actors.
After the receiving the instruction, required number of the people is tried to get.
If it’s succeeded, because the next task is executed immediately and the red box of the task is placed just below the yellow line.
If it is not succeeded, a green line is drawn to show the task was postponed.
Blue lines mean waiting time for others.
If user finds some problem such as long postponed task (green line), long waiting time (blue line), no reaction and so on, by right-clicking a line, a red box or an arrow line, the corresponding state or event handler of the “State Chart Diagram” is displayed by the Knowledge- base editor immediately and the user can check the scenario data and correct it rapidly.